SM0 · Data Room · ~10 minutes

The reported NAV — and the plan to rebuild it.

Alstria Office REIT, FY2008. The audited balance sheet, reshaped into the NAV calculation — and exactly which lines you'll independently re-value to land your own number.

The official source · AR2008 p.50–51
Alstria AR2008 consolidated balance sheet assets: investment property 1,805,265, cash 31,426, total assets 1,873,493
The audited Consolidated Balance Sheet (assets). Our table is this, reshaped.
Alstria AR2008 balance sheet equity and liabilities: total equity 729,667, long-term loans 1,086,801, short-term loans 12,609
Equity & liabilities. Equity 729,667 ÷ 56m = €13.03.
1 Step 1 of 4 · The brief Read · ~90 seconds. Then continue at the bottom.

Germany's first listed office REIT, year two, mid-crisis.

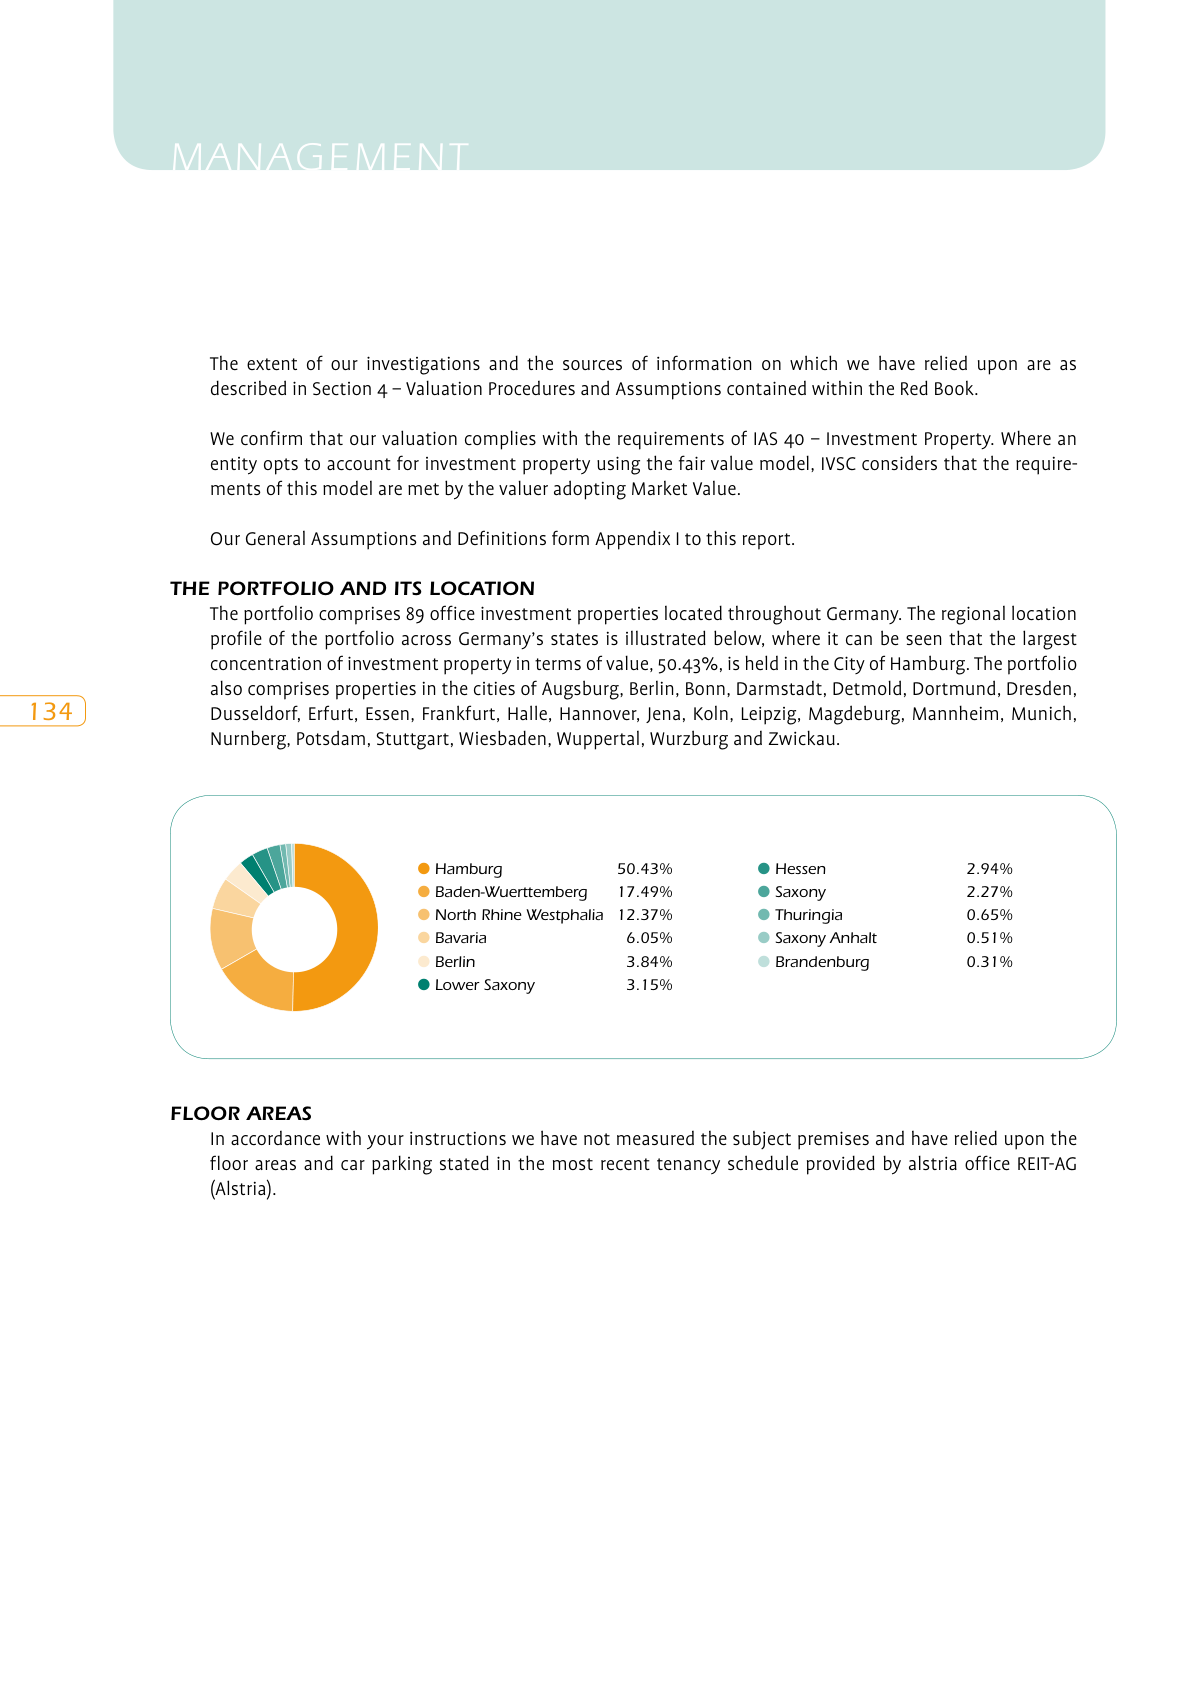
Alstria Office REIT-AG floated in April 2007 — Germany's first G-REIT — with a German office portfolio concentrated in Hamburg and Stuttgart. By early 2009, shares had fallen ~74% from their 2008 high and traded at a 73% discount to NAV, while the analyst community focused on financial-distress scenarios and deleveraging.

That reported NNNAV rests on property values set by an independent external appraiser — not the company's own marks. But an appraisal lags the live market. You'll build an independent NAV at current cap rates, from this annual report, to set against it.

What's reported

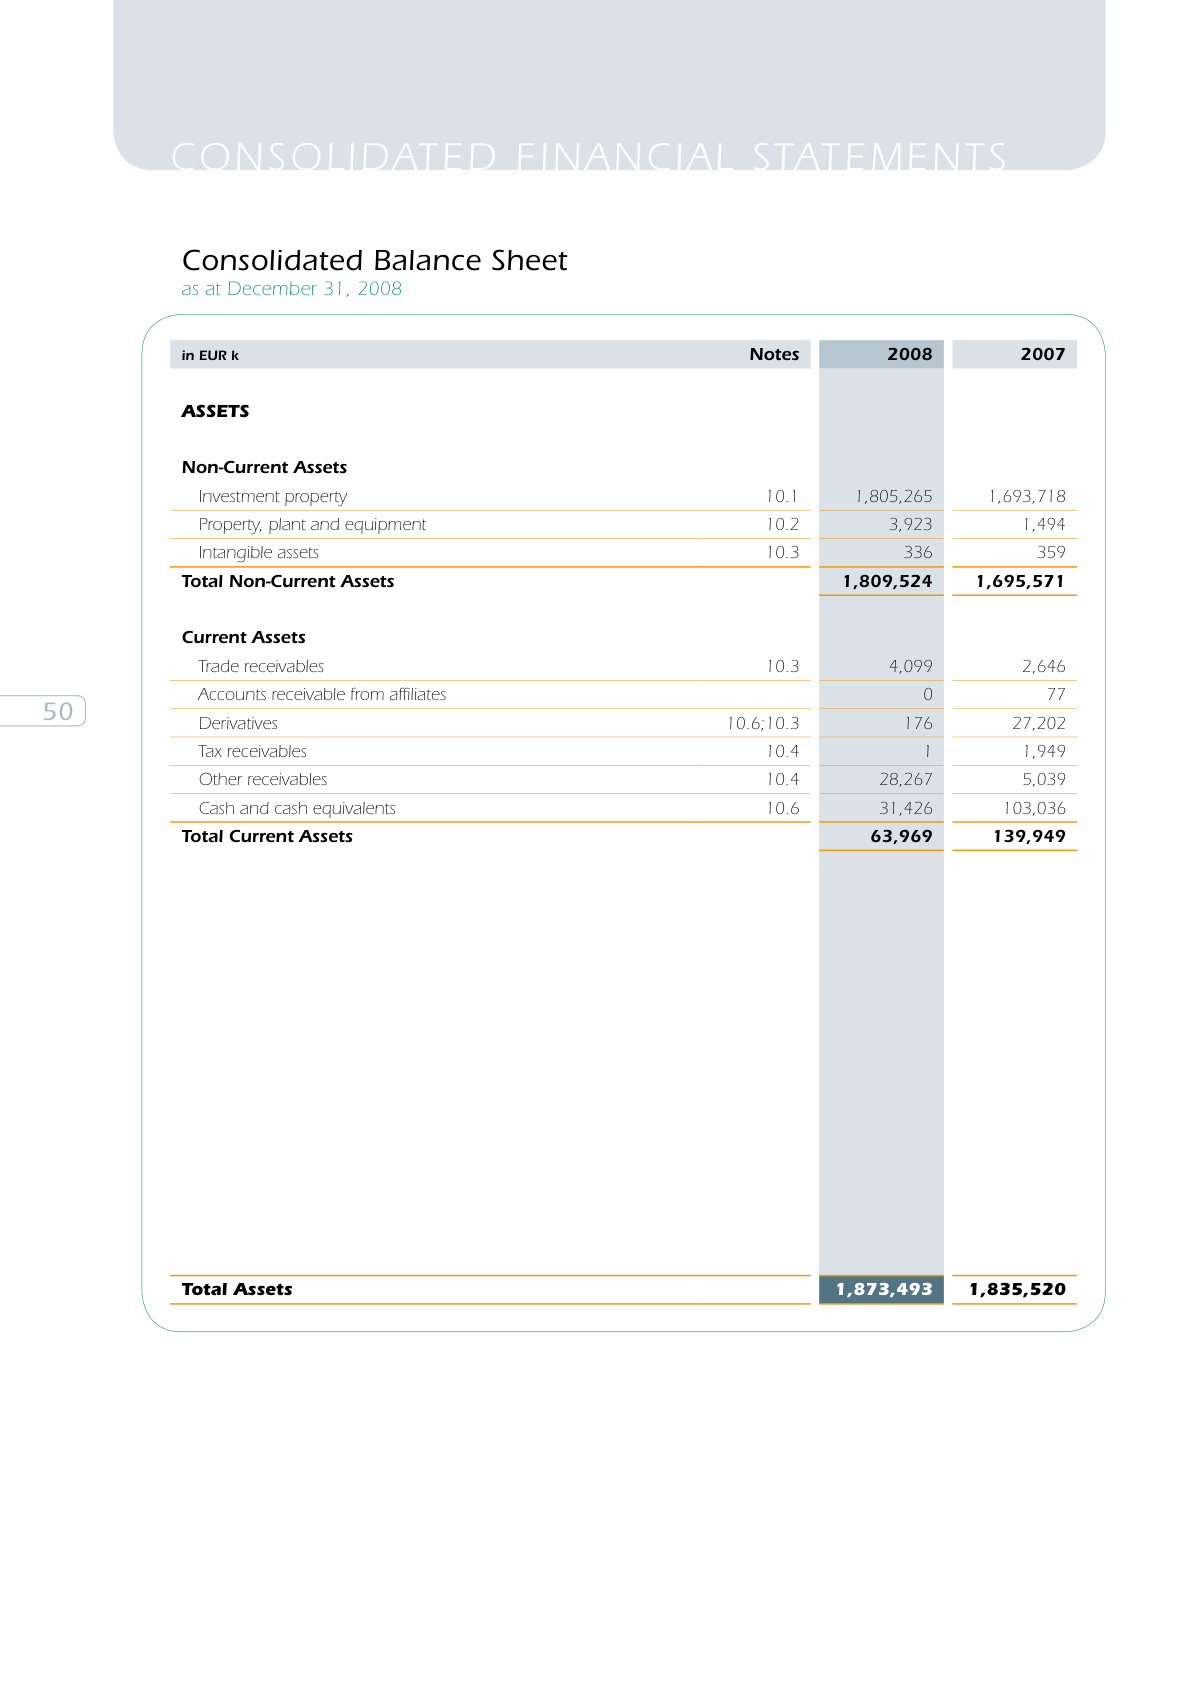
Investment property at "fair value"

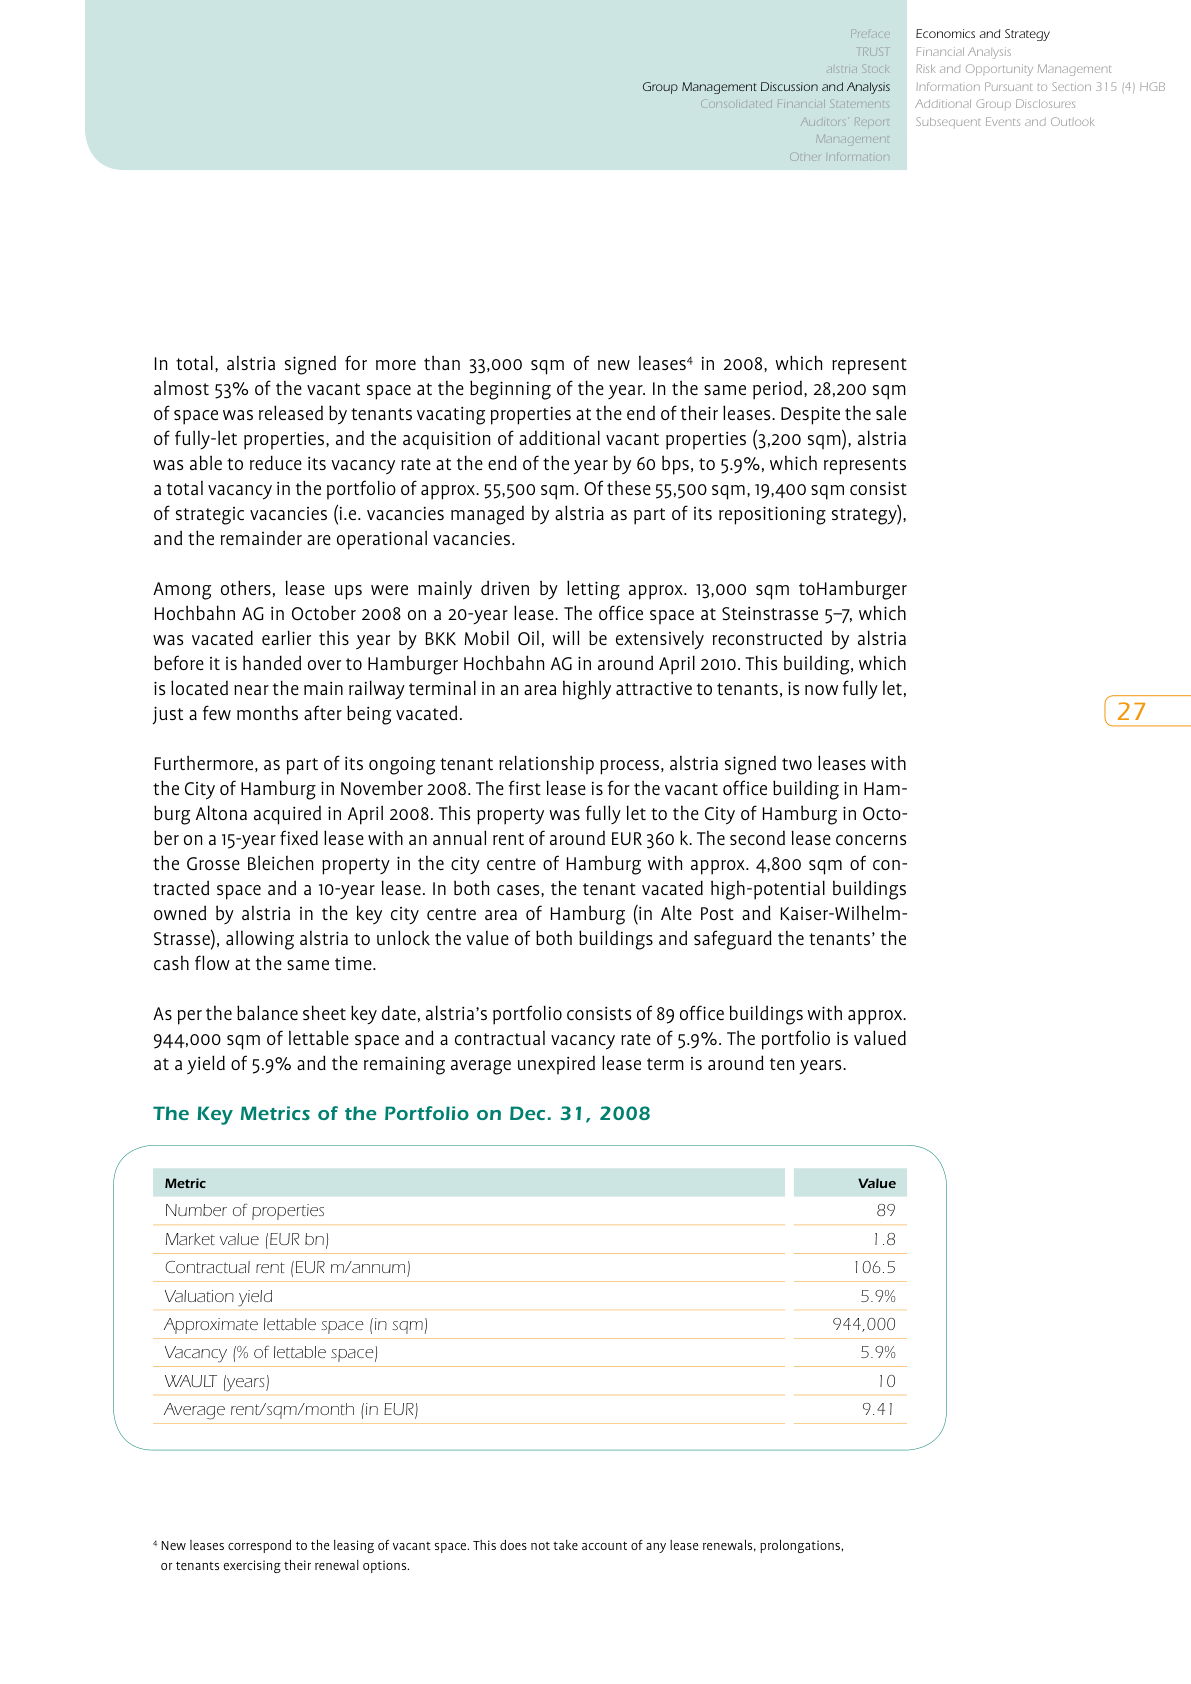
The portfolio sits at €1,805m (a 5.9% gross valuation yield) at 31 Dec 2008 — but valued on an income approach, for want of recent transactions. By the 31 March 2009 results date, the market had moved well past that mark.

What you'll challenge

Where the gap comes from

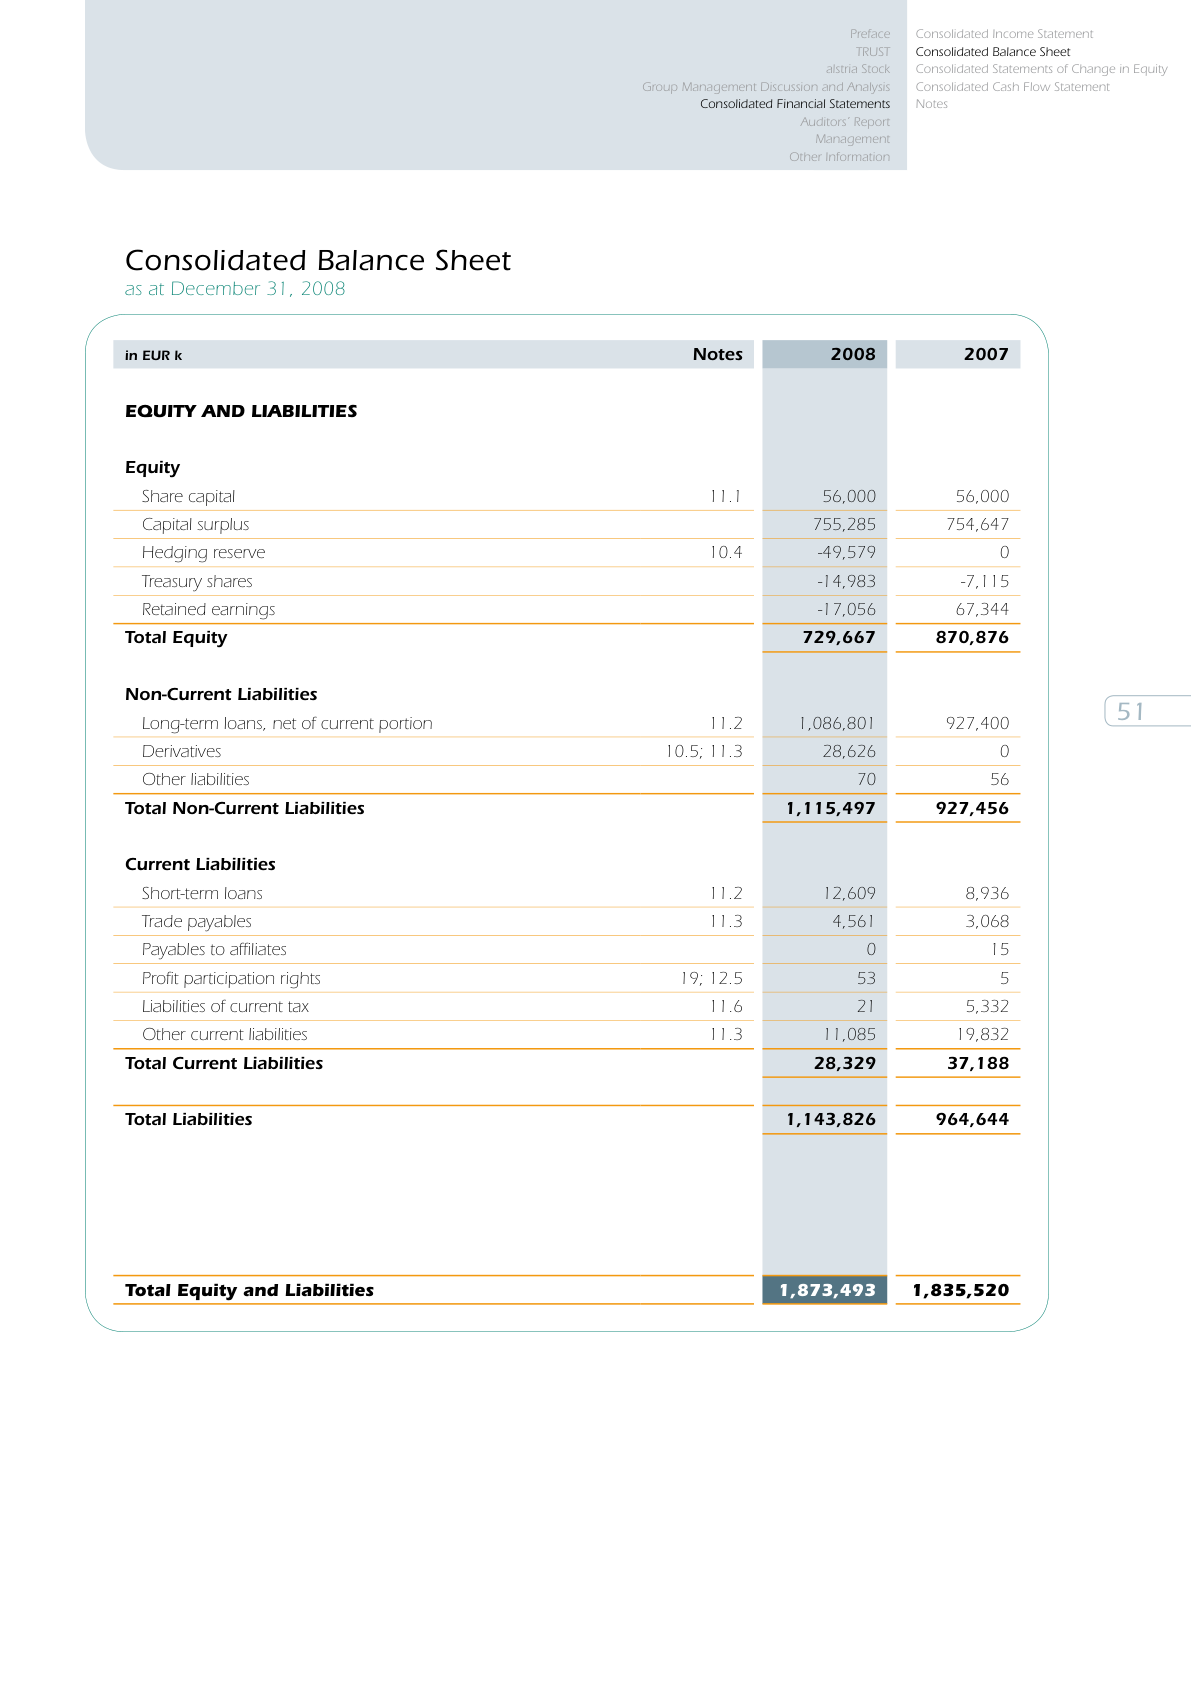
The cap rate re-values the property — almost all of the gap comes from there. The development & JV pipeline is the next-biggest difference from the appraised book. The debt barely moves it: it's floating-rate, so its carrying value already ≈ market.

Reported "valuation yield" is GROSS — AR2008 defines it as "contractual rent in relation to the fair value of the property"
5.9% = contractual rent €106.5m ÷ fair value €1,805m
We value on the NET initial yield instead — NOI ÷ value
5.2% = NOI €93.2m ÷ fair value €1,805m
The two differ by the NOI margin (NOI ÷ rent)
net 5.2% = gross 5.9% × (€93.2m ÷ €106.5m) = 5.9% × 87.5%
AR2008 — glossary definition; rent & NOI from the income statement; value p.27.
Source · AR2008 p.134 · independent valuer's report
Alstria AR2008 p.134: appraised value by German region — Hamburg 50.43%, Baden-Wuerttemberg 17.49%
Appraised value split by region — Hamburg 50%, Baden-Württemberg 18%, the rest spread across Germany.
Source · AR2008 p.27 · portfolio key metrics
Alstria AR2008 p.27 Key Metrics: 89 properties, EUR 1.8bn, 5.9% yield, 944,000 sqm, WAULT 10y
The whole portfolio in one table — 89 properties, €1.8bn, 5.9% yield, 944k sqm, WAULT 10y.
Why this case matters: "fair value" under IFRS is a managed estimate — appraisers anchor to prior marks, management resists writedowns that breach covenants, and the published yield always lags the transaction market by 6-12 months. The analyst's job isn't to argue with the auditor — it's to build an independent number and stand behind it. That number is what you'll have at the end of SM6.
2 Step 2 of 4 · The roadmap Scan the seven sub-modules. You're on SM0 now.

From the balance sheet to a defensible NAV — in seven moves.

Each sub-module shows you a source document, asks for your judgment, then checks it against the analyst model. The output of one becomes the locked input to the next, so by SM5 the NAV bridge writes itself. SM6 reconciles your number to the reported NNNAV and itemises every delta.

0
Data Room — you are here
Read the brief. Inventory the source documents. Note the "reported NAV to beat."
In progress
1
Balance-sheet triage
Classify every BS line: face value, revalue, or exclude. Lock "other assets" and "other liabilities."
Next →
2
Revalue the investment property
Stabilised NOI per region · cap-rate build from broker evidence · capitalise to GAV.
Pending
3
Development portfolio
Completion GAV less cost outstanding less time-and-risk discount, JV pro-rata.
Pending
4
Revalue the debt
Floating loan ≈ par · swap-book mark · credit-margin gap. EPRA NDV logic.
Pending
5
Assemble the NAV
Stitch the bridge. Premium/discount to share price. Cap-rate sensitivity.
Pending
6
Reconcile & verdict
Bridge your NAV vs reported NNNAV of €13.03. Itemise every delta. Write the analyst note.
Pending
3 Step 3 of 4 · The source docs Scan the six sources. You don't need to open anything yet — they'll be linked from each sub-module.

Everything in this case traces to a real document.

The audited Alstria filings, the current market-yield evidence a March-2009 analyst would mark to, and the working model that shows how the calculation is structured. Every figure you'll validate traces back to a real document.

Alstria Annual Report 2008
alstria_AR_2008.pdf · 158 pp · English · primary source
FY2008 audited financials. Balance sheet, IP note, debt note (11.2), derivatives note (10.5), deferred-tax note (11.5), NAV bridge (p.35–39), external valuation report (p.133–143), per-property appendix (p.144–149).
primary
Alstria Annual Report 2007
alstria_AR_2007.pdf · 70 pp · comparator
IPO-year report. Used for equity bridge and 2007 comparators where AR2008 only shows the headline restated number.
comparator
Alstria Annual Report 2009
alstria_AR_2009.pdf · 114 pp · forward read
Source for the 2009 share-price path (publication-day close €3.56) and the FY2009 −5% portfolio devaluation; 2008 comparatives get a second pass.
forward read
Deutschland CRE Research · German office yields, March 2009 (reconstructed exhibit)
market-evidence exhibit · introduced in SM2
A clean, copyright-safe reconstruction of the city-level office yields a March-2009 analyst would mark to, built from real broker market reports. Fictional research firm; the numbers reflect the actual GFC market.
reconstructed
AOX GR.xlsm — analyst working model
AOX GR.xlsm · tabs: Port · SSNOI · NAV · Dev't · CF Model · BS Stats
The working valuation model — used to show how the NOI, cap-rate and NAV calculations are structured. A method reference, not the source of this case's numbers.
method
Alstria FY2009 results press release
eqs-news · HTML only · 4 Mar 2010
Confirms the FY2009 −5% devaluation, FFO €39.4m, operating context. Used as a sanity check on the FY2008 → FY2009 trajectory.
sanity check
4 Step 4 of 4 · Numbers to anchor Skim the six anchors. They'll appear in every sub-module.

Six anchors that show up in every sub-module.

Portfolio
€1,805m
Investment property at 31 Dec 2008 · valuation yield 5.9% · WAULT 10 yrs · vacancy 5.9% · 944k sqm · 89 assets, mostly office.
Debt
€1,086.8m
LT loans carrying value (Note 11.2) · syndicated facility (JPM/Natixis/HSH) plus Deutsche Hypo · interest = Euribor + margin, floating, swapped to fixed · LTV 59.1% (covenant 60%).
Swaps
−€28.5m
Derivative book FV at year-end (Note 10.5) · notional €1,104.7m · hedge reserve −€49.6m sits in equity · ineffective portion in P&L −€5.5m.
Equity
€729.7m
FY2008 book equity · 56.0m shares · book per share €13.03 → NNNAV after EPRA adjustments. Equity ratio 40% — strong for the sector.
G-REIT regime
€0
Deferred tax (Note 11.5) · Alstria is fully tax-transparent from 1 Jan 2007 onward. No DTL to strip out — the SM1 exclusion exercise is about something else.
FY2008 P&L hit
−€88.1m
IP fair-value adjustment (Note 12.9) · the FY2008 write-down that took the book to a 5.9% yield — and the market kept re-pricing past it into 2009.
Continue ↓